


Donut Chart Maker
Design beautiful donut charts quickly and easily with this free, zero-sign-up tool.
A donut chart is a simple visual that uses divided slices to show parts of a whole.
Each slice represents a value, and the size of each shows proportions that are larger, smaller, or equal.
It's one of the clearest ways to compare categories, segments, or distributions at a glance.
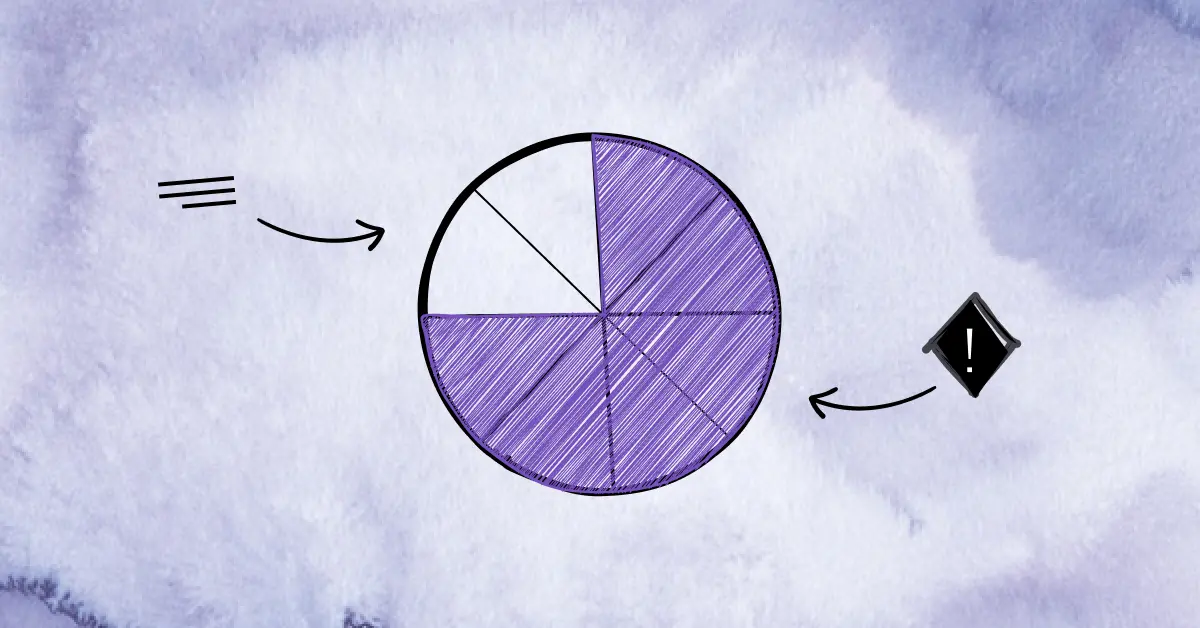 What is a Pie Chart?
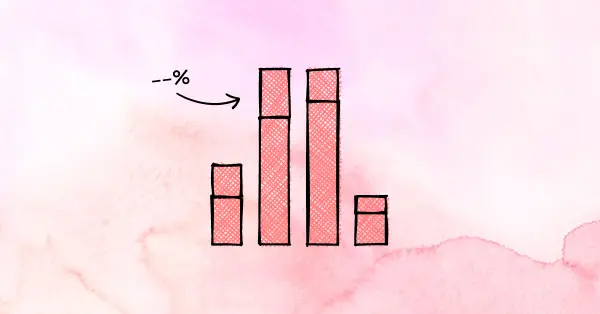 What is a Bar Chart?
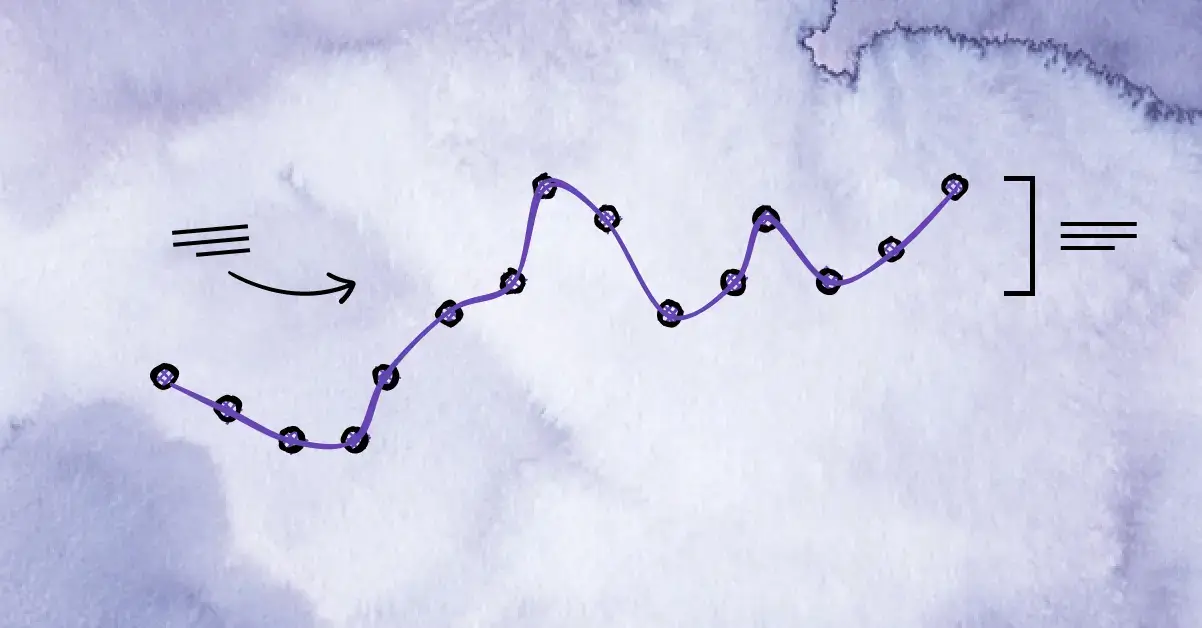 What is a Line Chart?